Integrated Framework for Spatial Accessibility Analysis
This post is based on a paper presented during the eCAADe conference 2019, it introduces a prototype for a user-friendly, responsive toolbox for spatial accessibility analysis in data poor environments to support urban design processes. It allows for real-time computation of several evaluation indicators, mostly focused on accessibility related measures. The proposed framework is exemplified using three real-world case studies. Each of them demonstrates one part of the workflow: data gathering and structuring, sketching and developing scenarios, and impact analysis and scenario comparison.
Introduction
This work is embedded in the discussion on contemporary planning practices, which criticizes its high degree of design drivenness and a lack of applying measurable performance metrics for evaluation. Moreover, understanding cities as large complex systems demands for an urban design approach that anticipates and plans with the self-organizational and market forces that shape cities – in contrast to a mere top-down approach, which might lead to infrastructures being built at places that do not meet the demand appropriately, potential leading to costly mismatches.
The use of an integrated simulation framework can help to tackle both of the issues described above. Below we briefly present the on-going work on such framework with the following characteristics that:
- … is focused on assisting in early design stages
- … works in data poor environments
- … is easily adjustable to new contexts, cases and scales
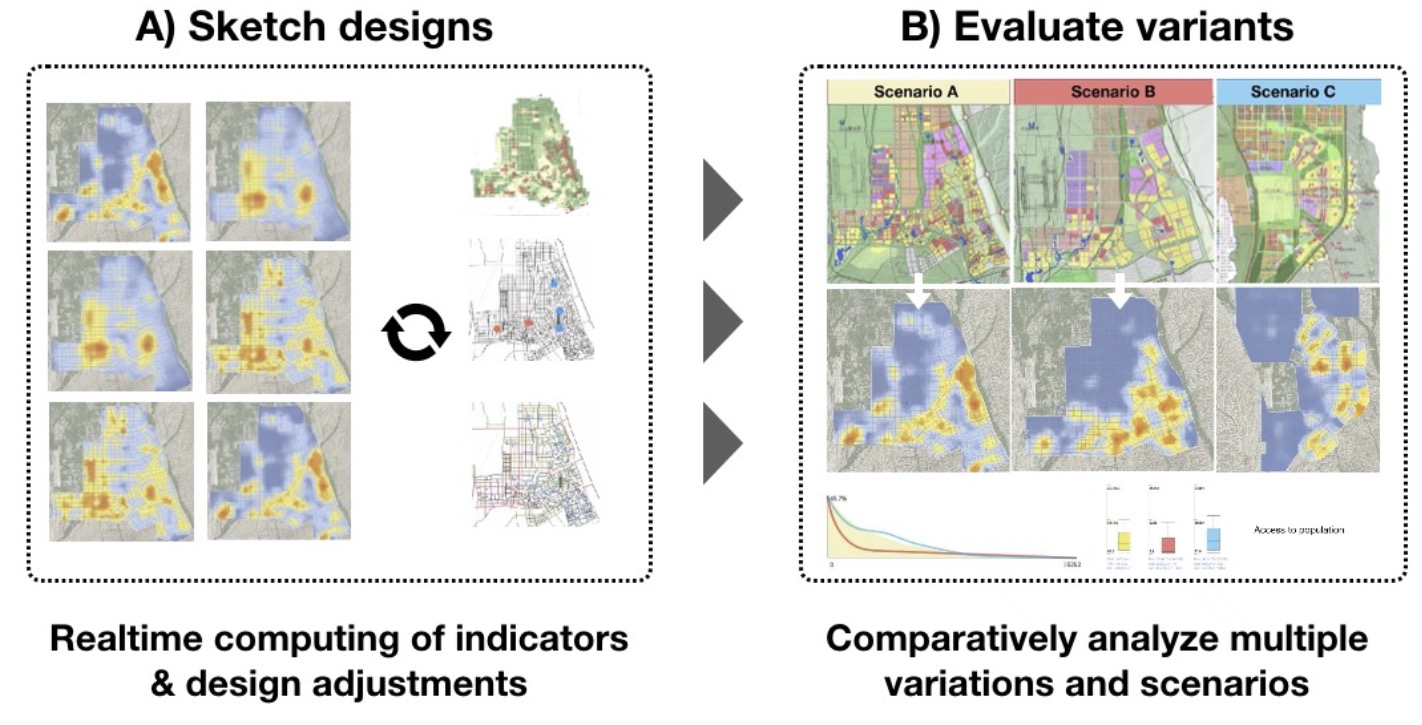
We aimed to cover two basic use-cases with the same framework: 1) computing a selection of metrics in realtime to enable interactive processes of data-driven design. 2) in depth and comparative analysis of multiple pre-computed scenarios at once for final decision making.
Functionality and areas of application:
Core of the framework is a multi-modal transportation graph that relates land uses, points of interest and demographic statistics (eg. the distribution of population and jobs) with one another. This allows eg. to compute accessibility metrics, estimate location choices, pedestrian movement patterns and the implementation of models capturing basic market mechanisms. By using an open platform, the framework can easily be expanded with additional simulation modules such as micro-climate or CFD related computations.
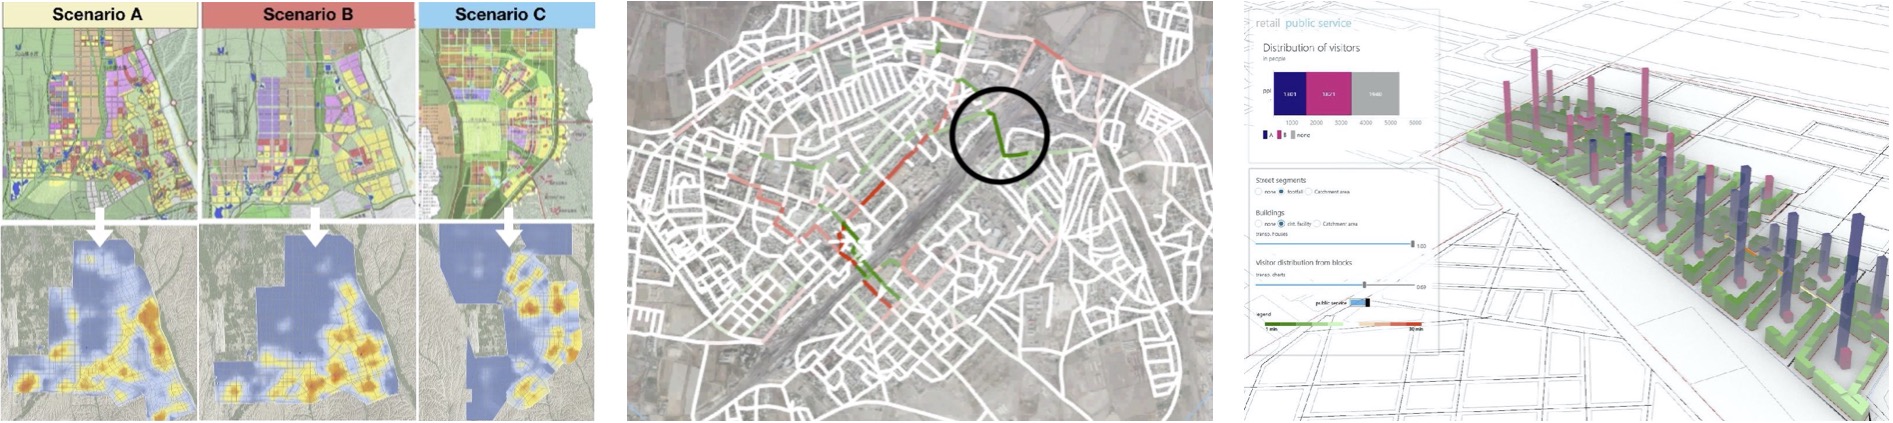
Based on this, a wide range of applications opens up, ranging from quantitative comparison of masterplans proposals (1) over conducting infrastructure impact analysis (2) to optimize location choices for both public and private entities (3). Below three examples of projects are given where an early versions of the framework was applied.
Vienna, Austria: testing our framework’s accuracy
We tooked Vienna to exemplify that our model works on the scale of big European cities and can leverage on the plenty available open data for this town. Moreover, we tested our simplified approach to transit modeling and its accuracy as compared to google maps routing.
Kagan, Uzbekistan: infrastructure impact analysis
Kagan is a medium sized city in Uzbekistan with very little data available. It was a joint project between the World bank, Superwien Architects and the AIT. Our framework supported the re-design of the city center. Among one of the projects assessed with our tools was the location choice for a second railway overpass. Please see here for more information.
Gela, Italy: workshop settings and interactive design sessions
In Gela our framework was used to support the re-designing of the local public transit system, in a workshop like setting. Here, the realtime feedback proved to be supportive for discussions among stakeholders and the communication of different proposals.
Moreover, we can easily extend our framework with interactive AR experiences: multiple users can collaboratively interact with our models and get real-time feedback on performance metrics. This video provides some impressions:
More details can be found in our paper.
Research Team: Serjoscha Düring, Ondrej Vesely, Andrej Sluka, Reinhard König