Waste Heat Search
1. Region choice
The following figure shows a screenshot of the UI and the Region Choice feature.
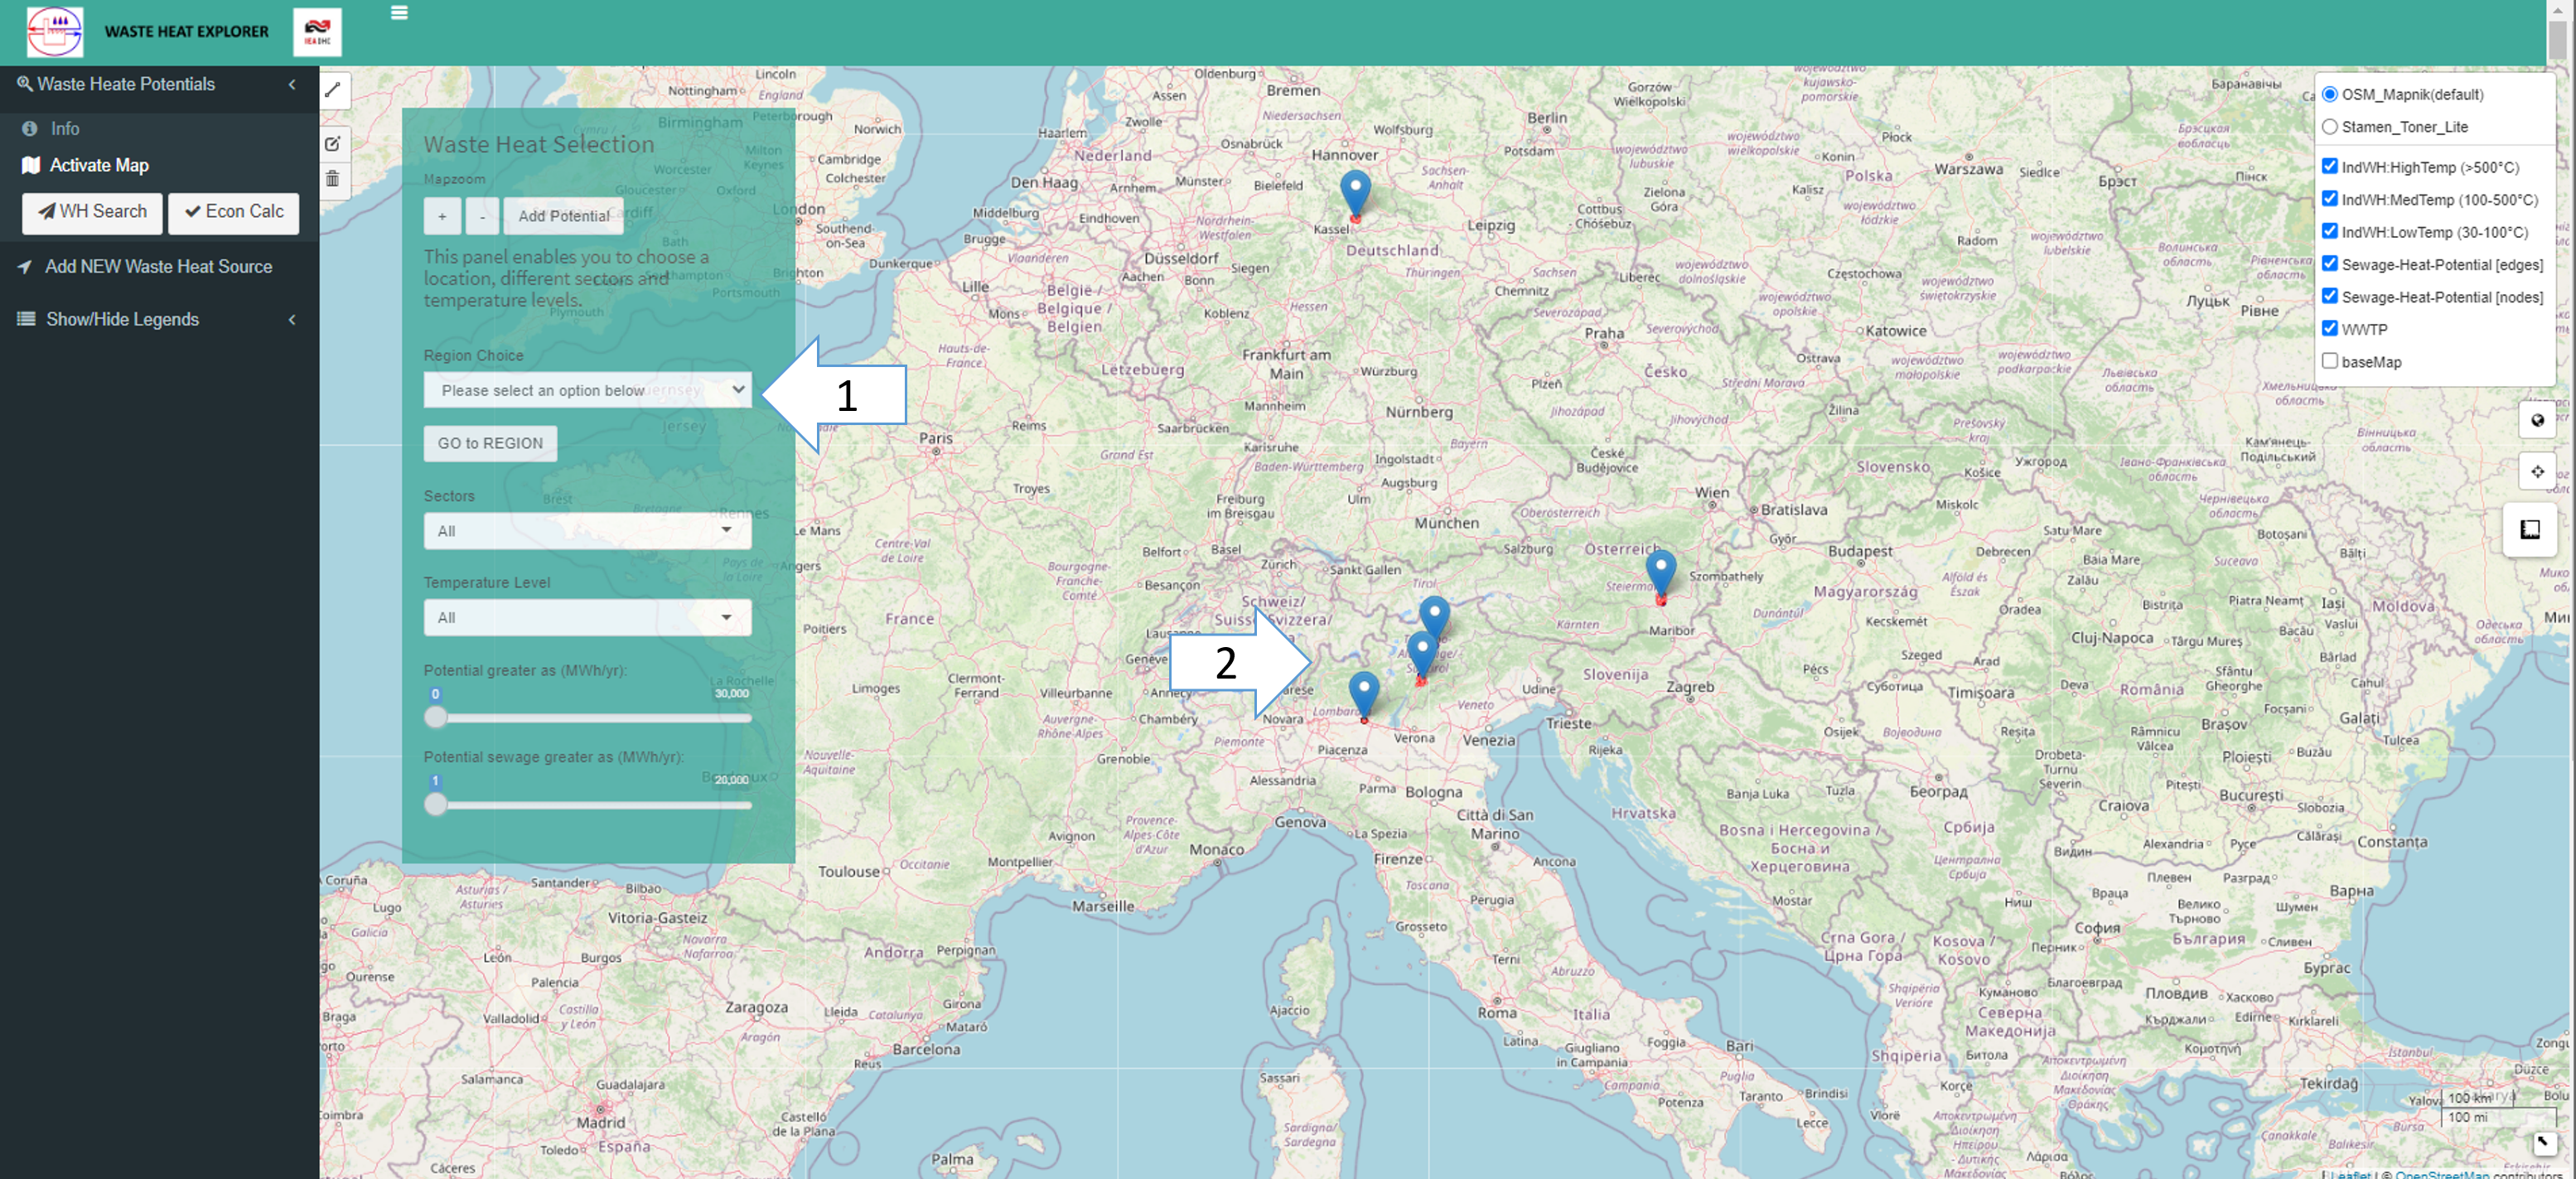
Figure 2: WHE Explorer selection of region © Memphis
2. The Sewage Waste Heat Data
The following figure shows for the region Goettingen in Germany the implemented sewage waste potential. The sewage network edges and nodes are depicted and can be hidden or shown (1) furthermore an interactive map feature clicking on the nodes (circles) shows the specific data (annual, as well as seasonal WH potential, and the respective temperature) within a popup menu (2). A filtering options was implemented enabling to filter regarding their annual waste heat potential via slider change (3).
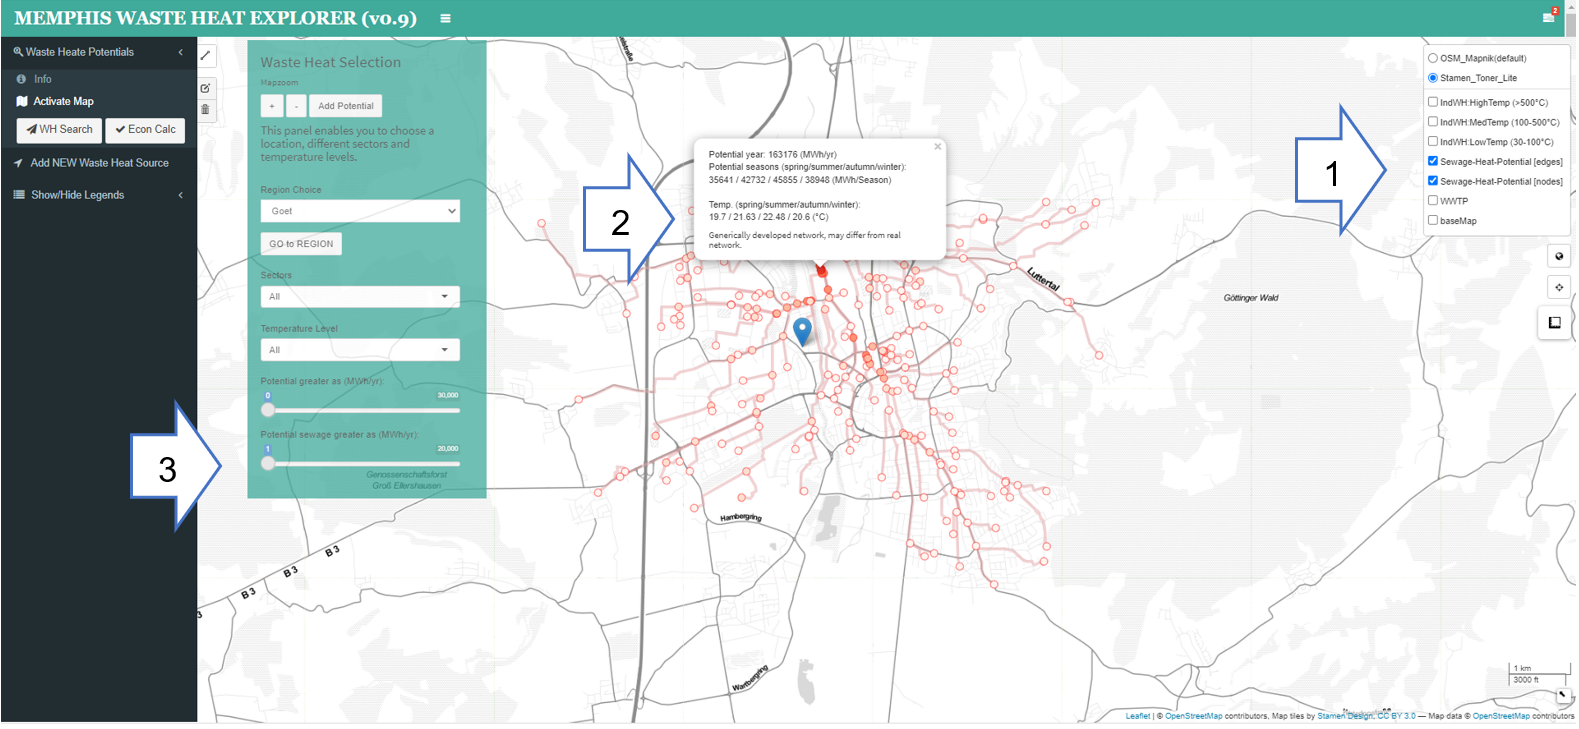
Figure 3: WHE Explorer Sewage Waste Heat Potential for Göttingen © Memphis
3. The Industrial Waste Heat Data
The following image shows the industrial waste heat potentials. The map activation section (1) enables to just visualize these layers and differentiate between three different temperature levels (low, medium and high). The show coloured circles (2) show the WH spots, whereas a click on the circle activates a pop up with more details (WH potential and seasonal share...). There is also the possibility to send an email if further interest (e.g. Company name and Address if hidden) arises.
The colour of the circle indicate the industrial sector as the legend (3) shows. The circle boundary is either solid or dashed which indicates it the source is a pre-processed one or has been added by an user see section Adding additional Industrial Waste Heat Sources below.
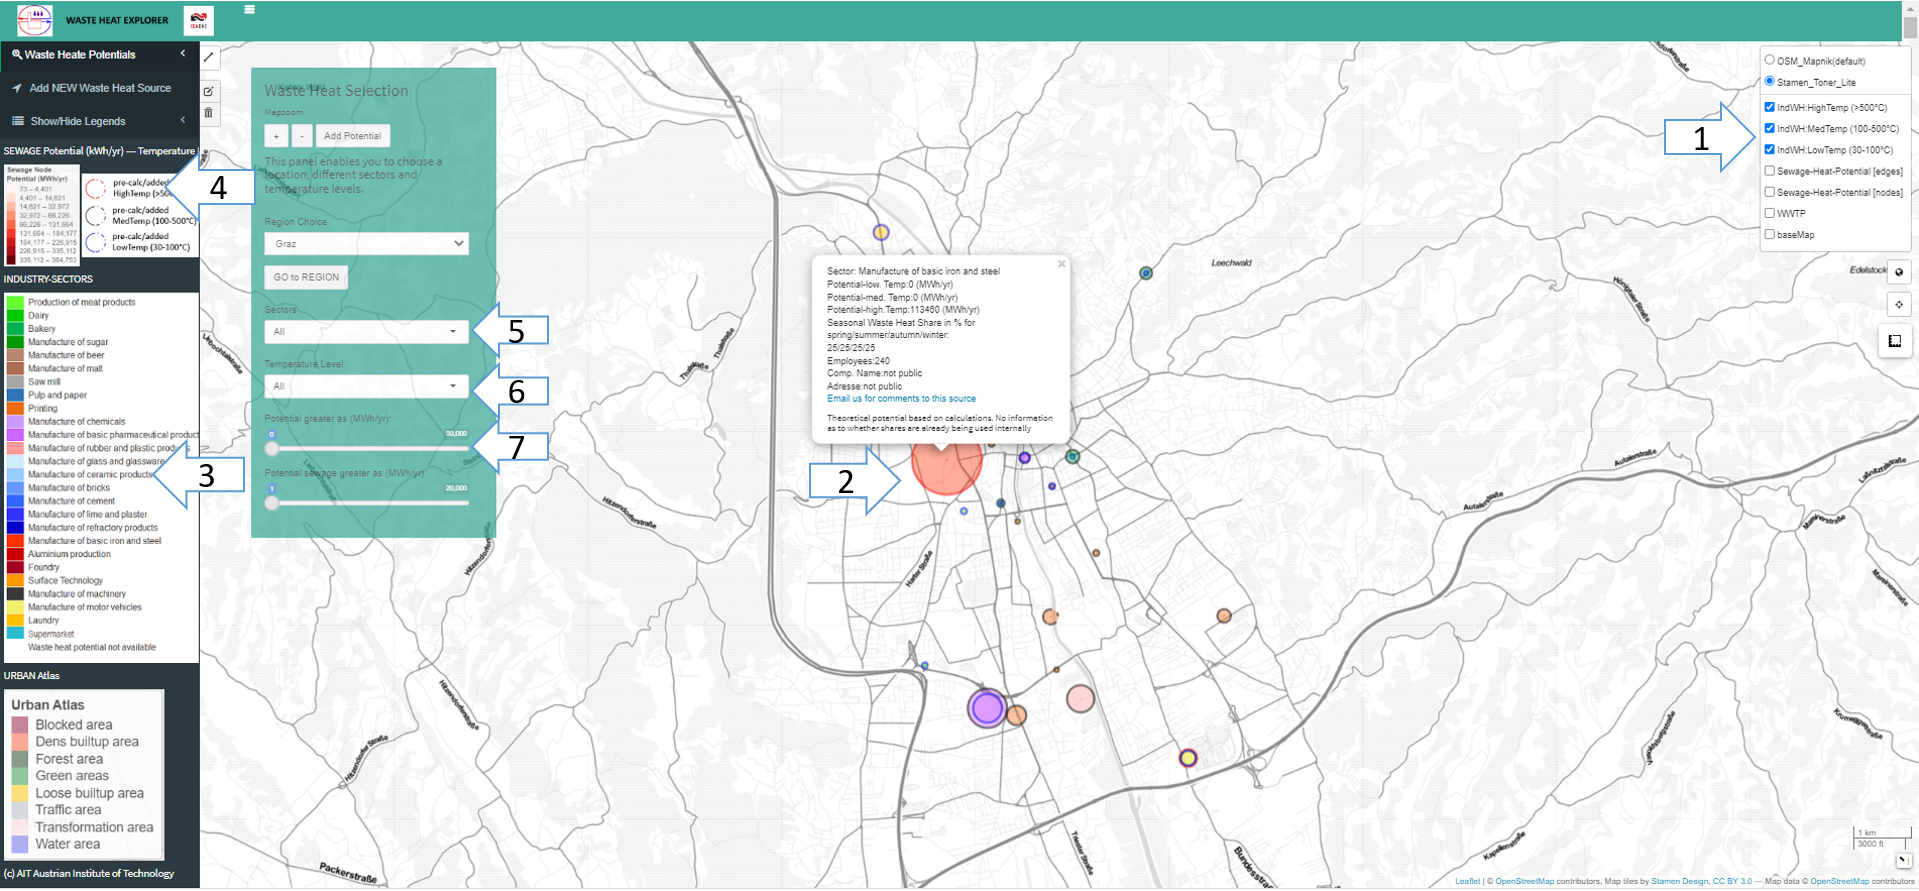
Figure 4: WHE Explorer Industrial Waste Heat Potential for Graz © Memphis